Project Information
- Category: DevOps / SRE – Monitoring & Alerting
- Technologies: Grafana, Prometheus, Linux, Alerting
- Client: iMaxeam – IBM Gold Business Partner
- Project Date: From October 2022 to Present
- Environment: Production & Live Infrastructure
- Monitoring Scope: Disk Usage, Swap, System Health
Designed and implemented a production-grade monitoring and alerting platform
using Prometheus for metrics collection and Grafana for
visualization and alerting across multiple live environments.
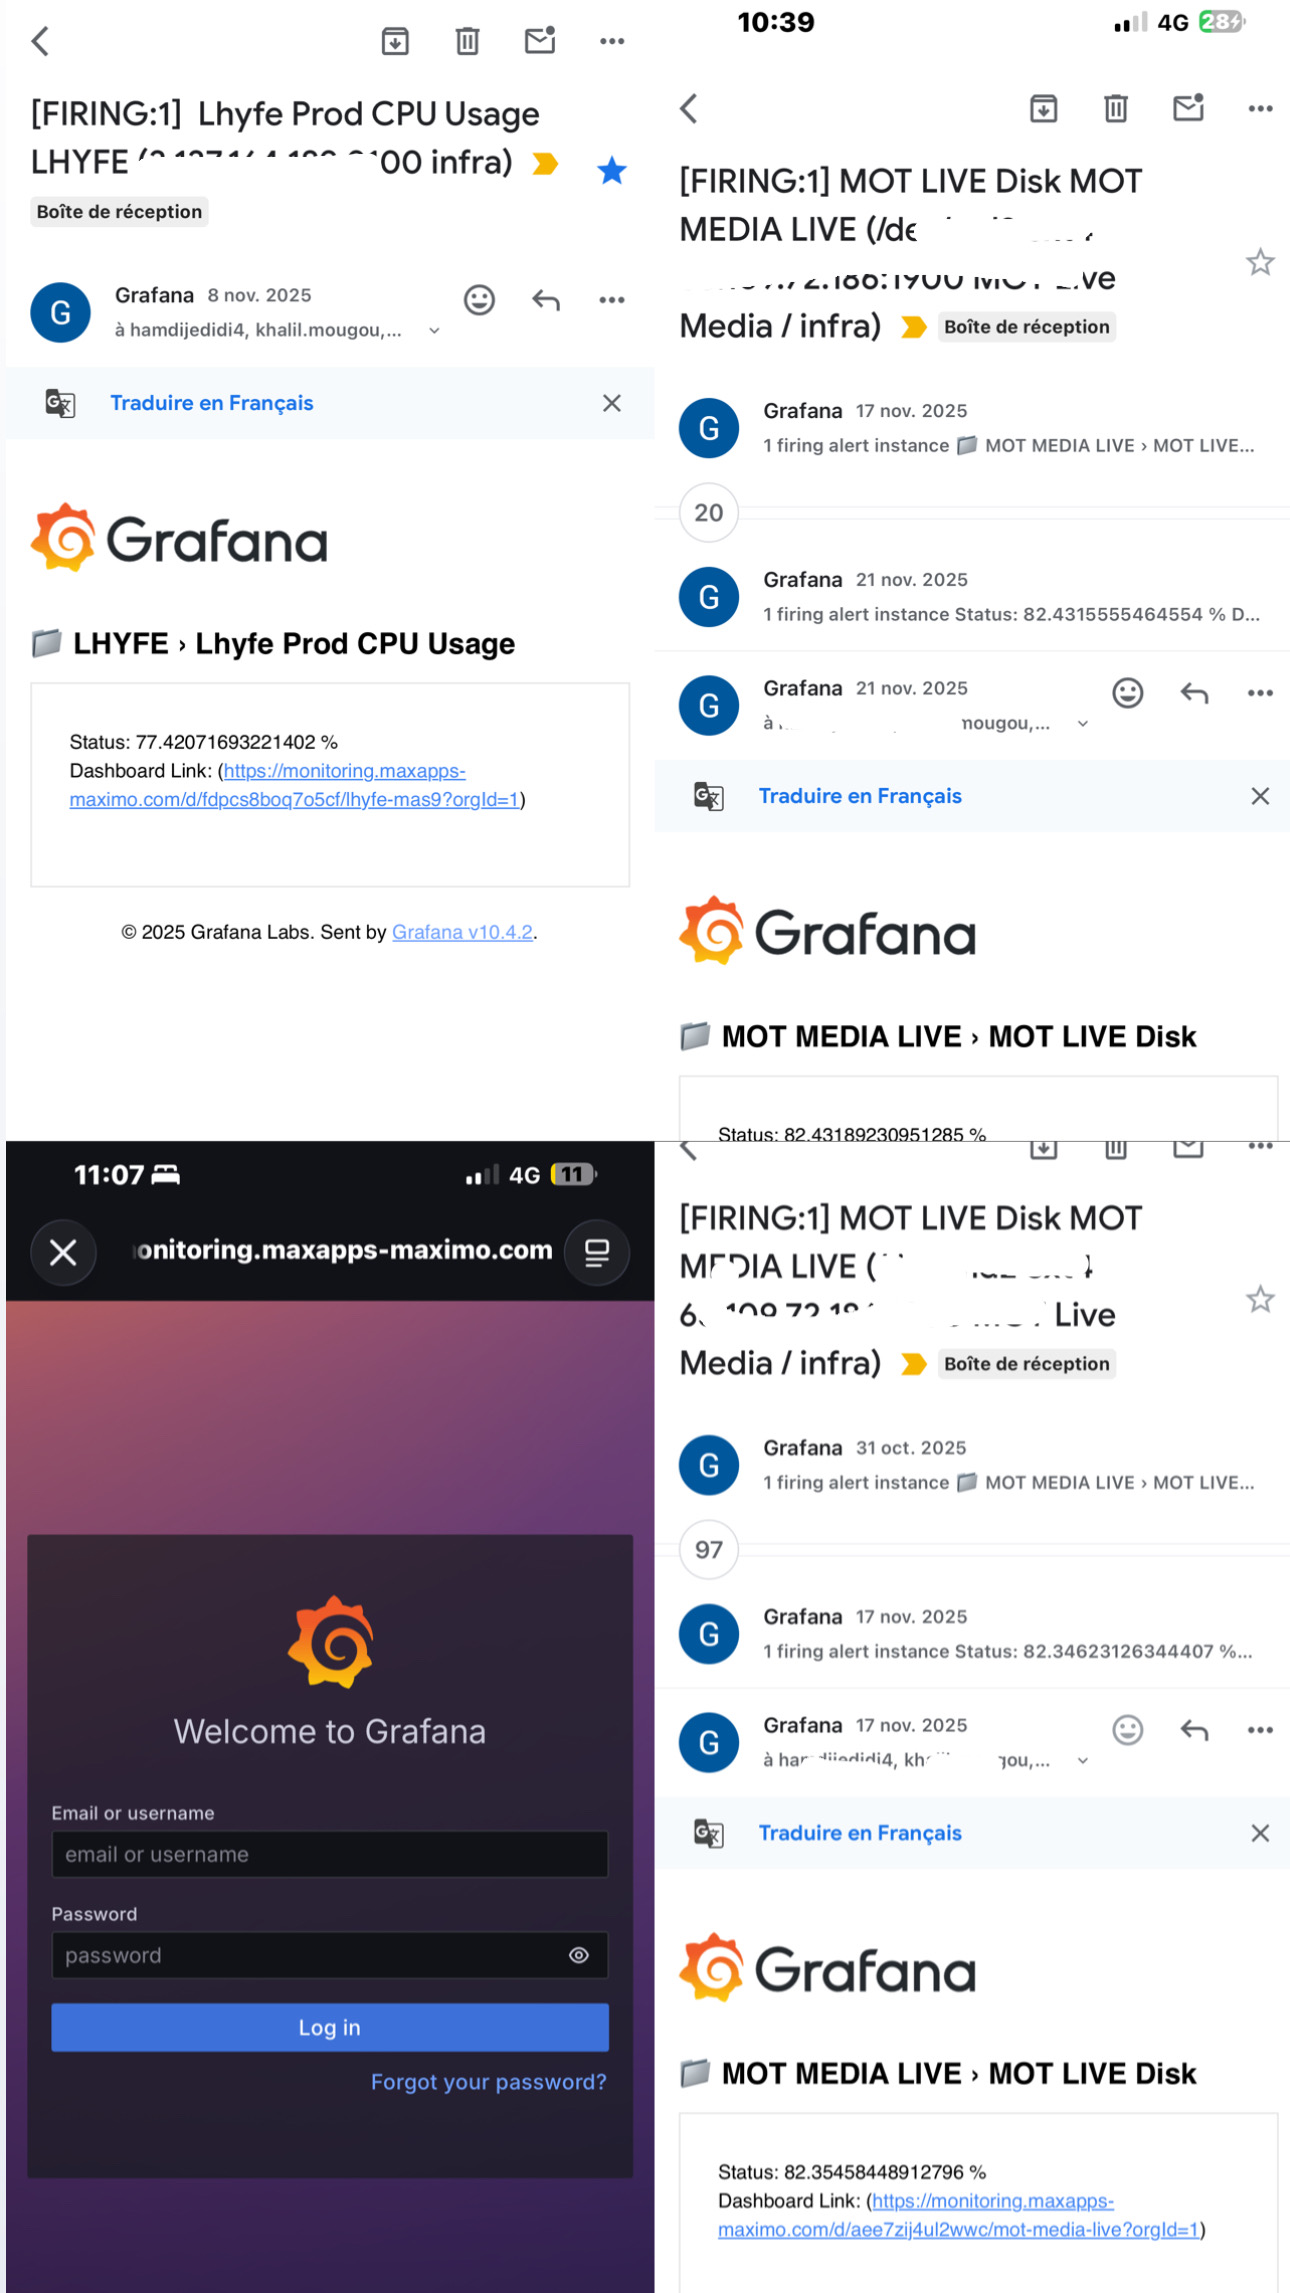
Built real-time dashboards to monitor disk space, swap usage, and infrastructure health,
and configured proactive alert rules (FIRING alerts) to detect critical thresholds before service degradation.
This solution significantly improved observability, incident response time (MTTR),
and ensured high availability for 24/7 production systems supporting business-critical workloads.